Students
When viewing each chart, click the “i” icon to view more information about the chart.
Back to:
Why it Matters (Snapshot, Comparisons, Trends)
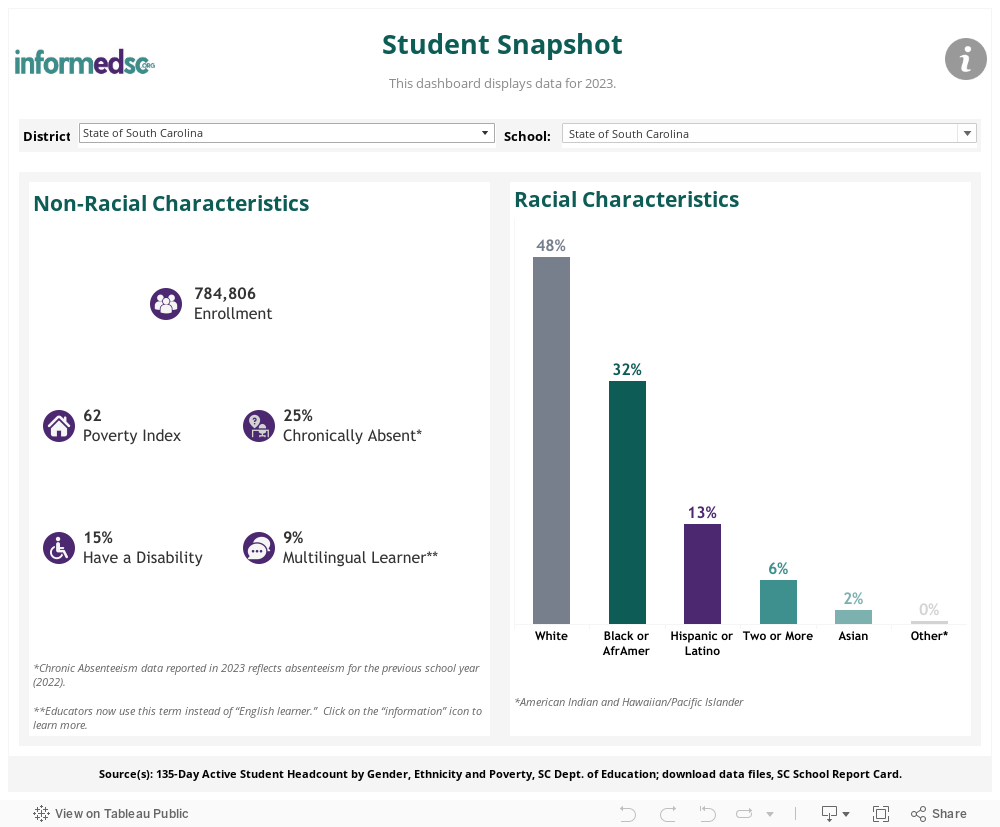
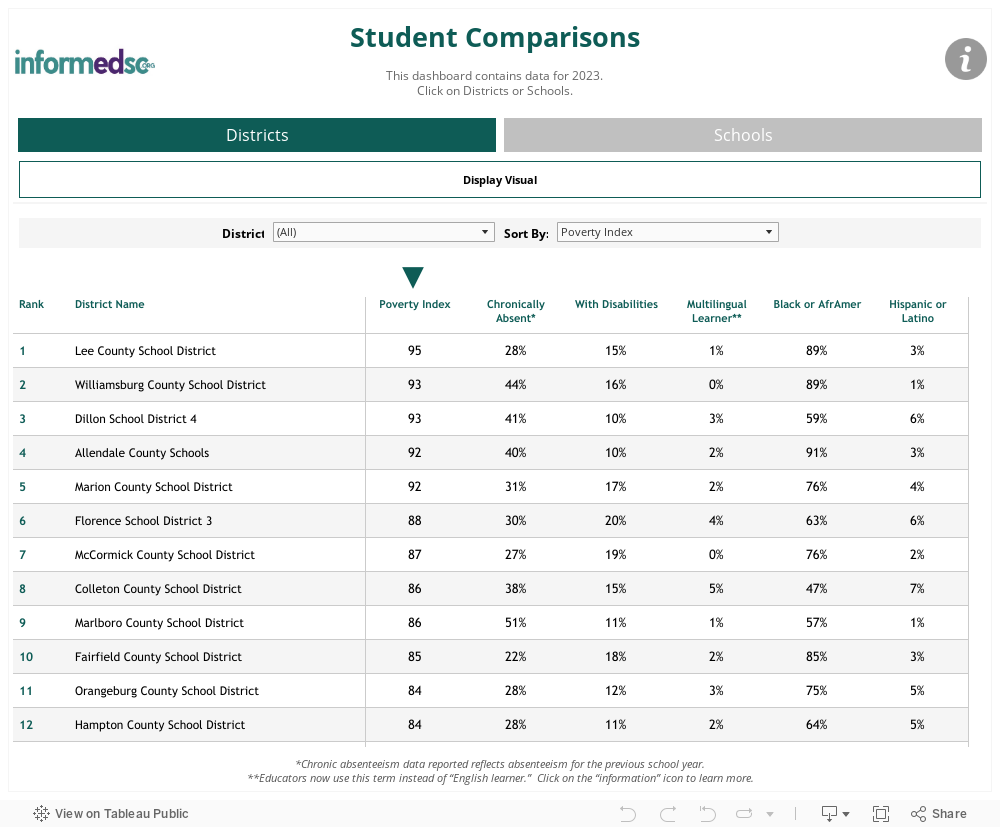
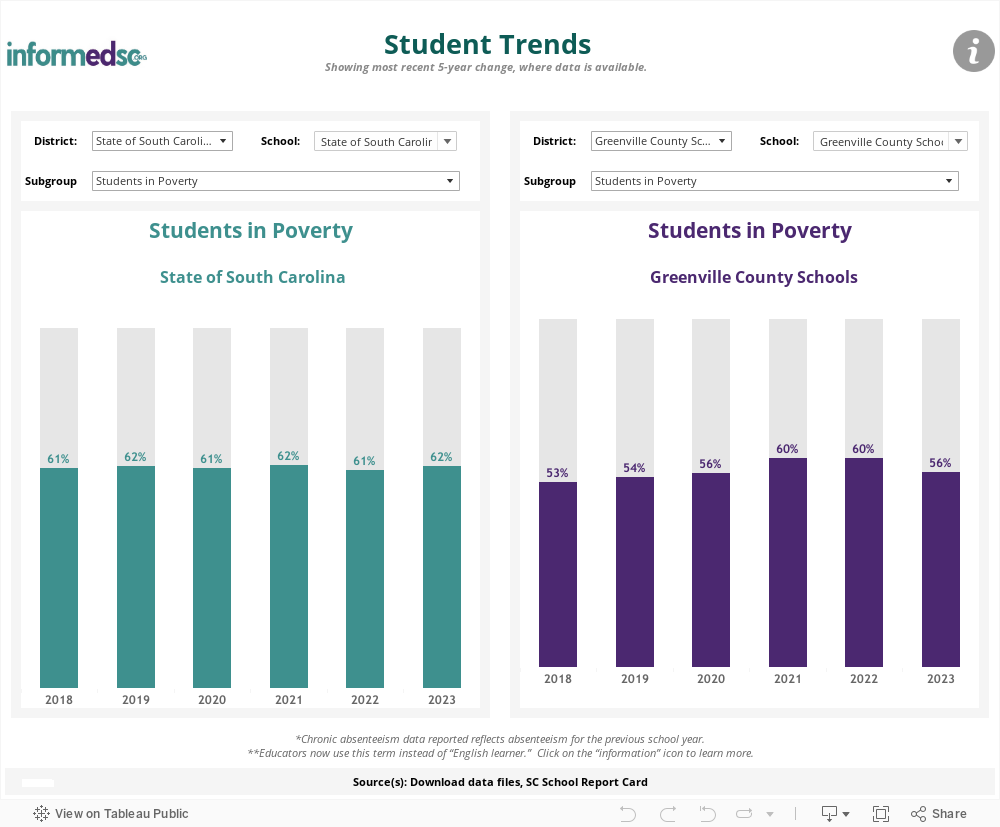
Students in Poverty
Adverse childhood experiences and traumas related to poverty directly impact a child’s ability to learn. Children from low-income households typically enter school behind their peers and never catch up. They often attend high-poverty schools that have a higher number of less experienced teachers, whose relative effectiveness may add to the achievement gap.
Chronic Absenteeism
Students who are chronically absent suffer academically and are more likely to not graduate from high school. Absenteeism in ninth grade is a strong predictor of dropping out of school. Absenteeism in early grades predicts absenteeism in later grades. Students in poverty are four more times likely to be chronically absent. Students with chronically absent classmates also suffer academically.
Students with Disabilities
Students with disabilities (in special education with an Individualized Education Plan) on average perform three years below their peers. Aggressive intervention is needed to reduce that gap. Unfortunately, school districts have difficulty filling special education teaching positions.
Multilingual Learner Students
Instead of “English learner,” educators increasingly are using “multilingual learner” to highlight that students are building proficiency in more than one language, which is a strength, not a deficit. This shift focuses on the strengths of individuals and places responsibility for educational experience on the system rather than the person. (Multilingual Learners, SRI Education.)
Multilingual-learner students score lower on standardized tests and have lower graduation rates than their English-proficient peers. They are less likely to enroll in preschool and advanced classes in high school even when they are accessible. Note that, unlike other groups, multilingual learners exit their subgroup upon becoming proficient in English. Current data does not capture these two sets of students.
Black or African American and Hispanic or Latino Students
Black and Hispanic children are more likely to experience adverse childhood experiences or ACEs that harm brain development. As these students get older, many do not fully engage in school because of responsibilities at home (work, childcare, etc.). Students of color benefit greatly from having a same-race teacher. However, teachers of color are underrepresented in the classroom.
Black or African American Students Specifically
Black students are overrepresented in school suspensions. Suspensions predict poor grades and school climate perceptions. Black students are more likely to experience bullying and teacher bias–bias that can contribute to Black-White disparities in academic achievement and suspensions.
Hispanic or Latino Students Specifically
A high proportion of Hispanic or Latino youths do not continue their education in order to help support their family. This is particularly true for foreign-born, Hispanic students.
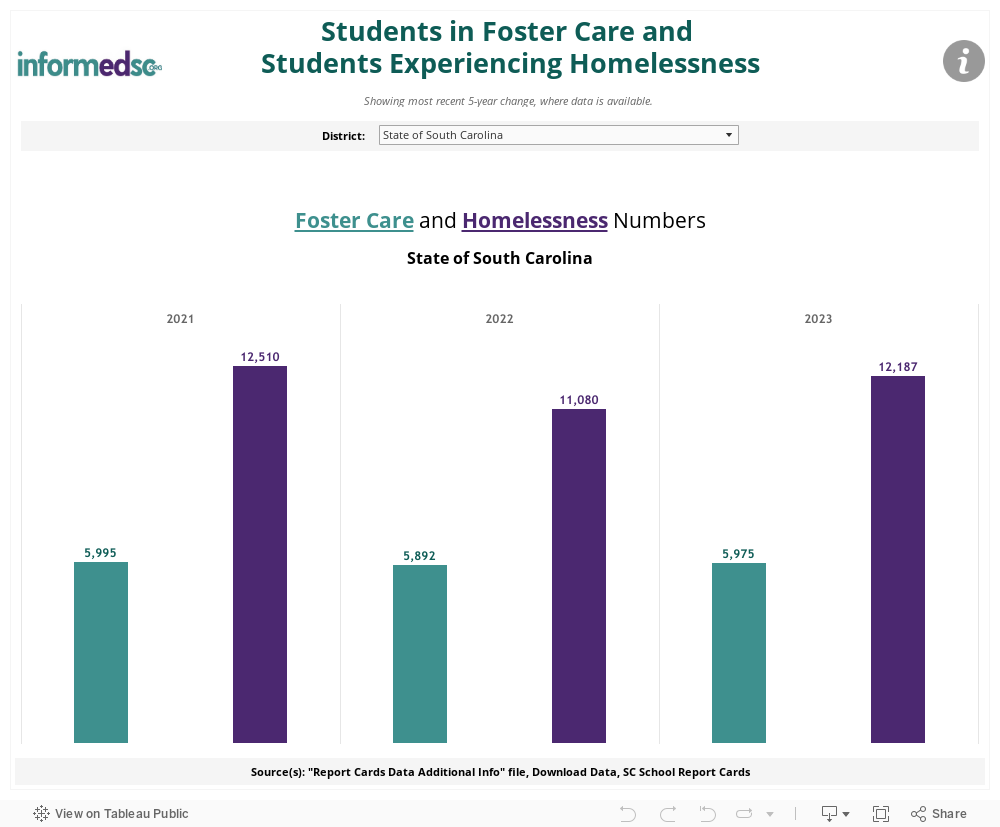
Why it Matters (Students in Foster Care and Students Experiencing Homelessness)
Students in Foster Care
Students in foster care, often from backgrounds of abuse, neglect, violence, and homelessness, face emotional struggles, such as anxiety and depression, and behavioral difficulties with adolescents twice as likely to have had an out-of-school suspension. Students in foster care, on average, miss more school, go through several school changes, perform worse academically, and more often fail a grade.
Students Experiencing Homelessness
Students experiencing homelessness lag in attendance, academic achievement, and high school graduation. These negative relationships persist after students become housed. The impact on achievement is over and above poverty.
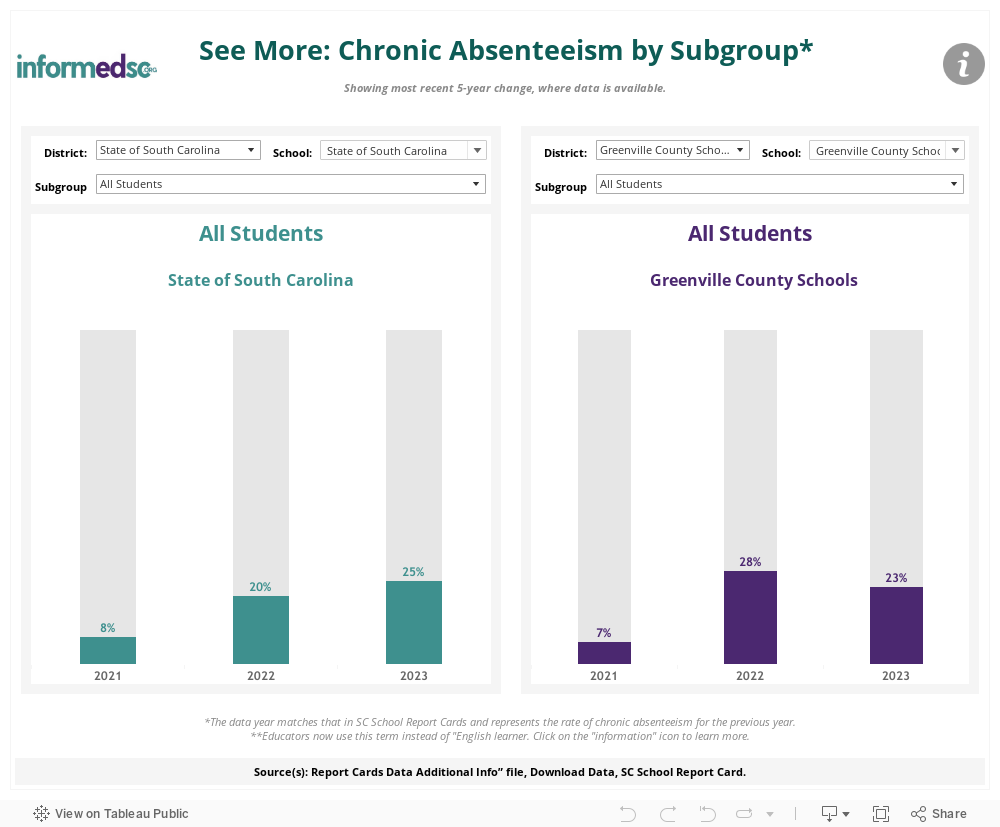
Why it Matters (See More: Chronic Absenteeism by Subgroup)
Chronic Absenteeism
Students who are chronically absent suffer academically and are more likely to not graduate from high school. Absenteeism in ninth grade is a strong predictor of dropping out of school. Absenteeism in early grades predicts absenteeism in later grades. Students in poverty are four more times likely to be chronically absent. Students with chronically absent classmates also suffer academically.